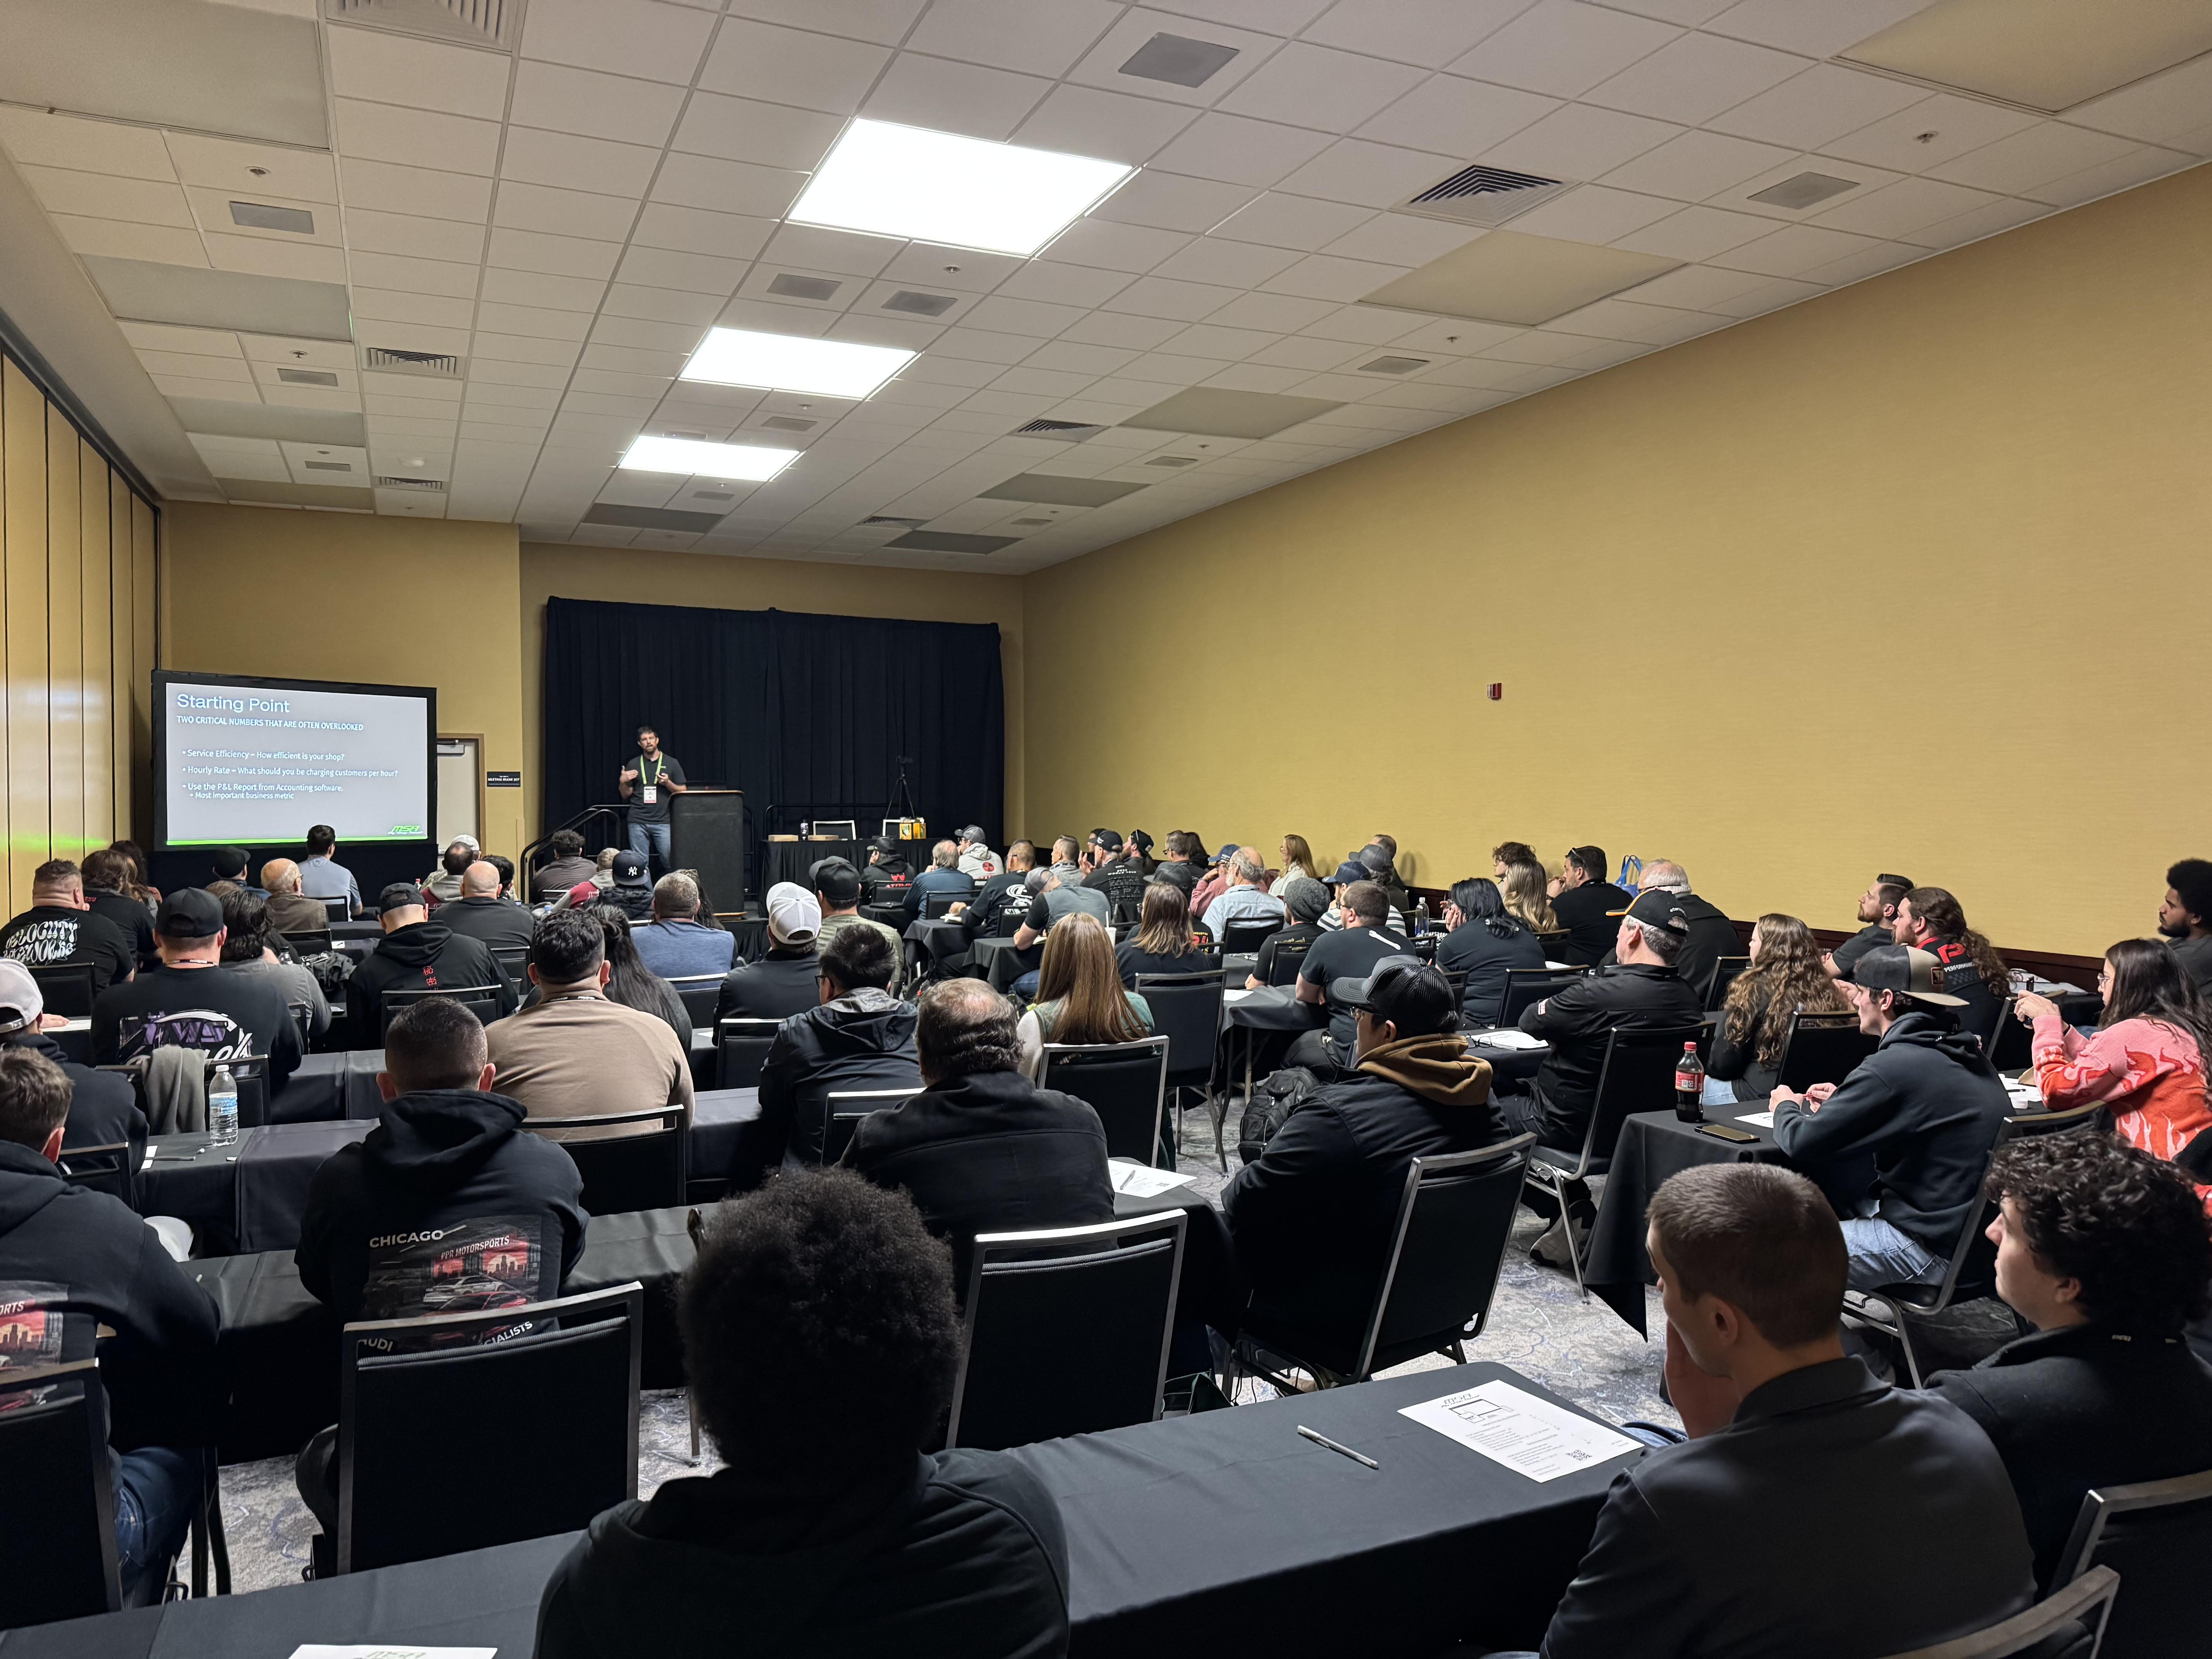

Every shop owner has had that month. The bays were full, the phone never stopped, everybody went home wrecked — and then the P&L came back ugly anyway.
That's the month that makes people question themselves. It shouldn't. Working harder was never the missing piece, because the problem isn't effort. It's that you couldn't see where the money went until the month was already over. That's a visibility problem, and you can't fix what you can't see.
This video walks through the three reports that turn a year's worth of guessing into a number you can check every week. Each one answers a different question, and they build on each other.
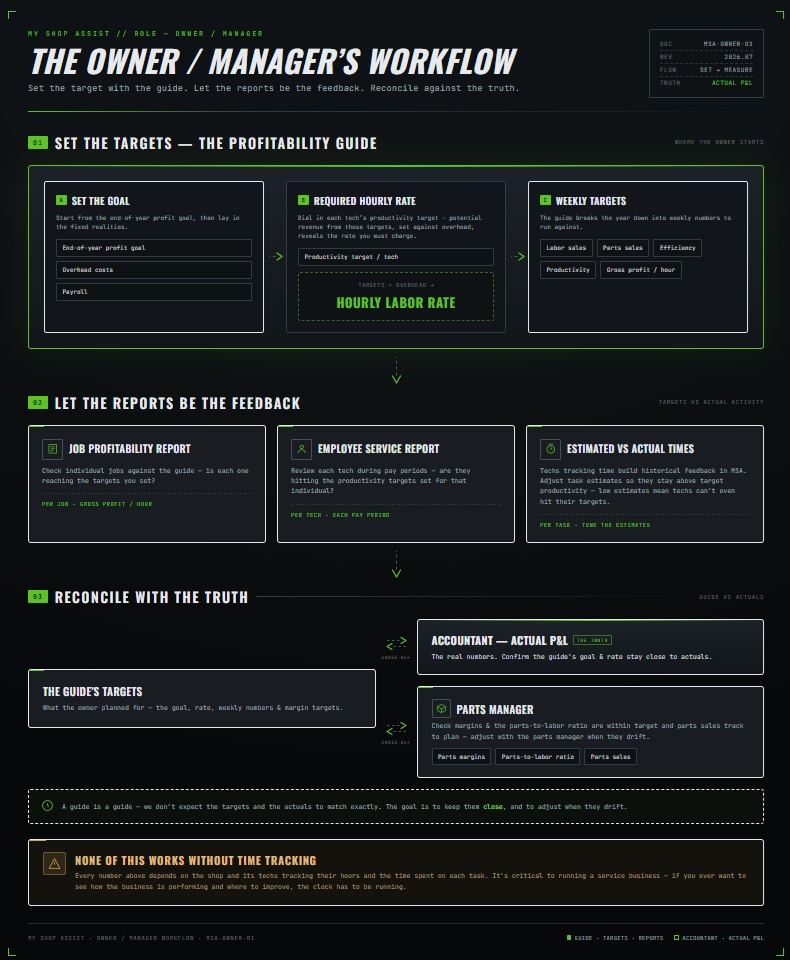
1. The Profitability Guide — what does success actually require?
Managing a successful shop starts with defining success, and that means putting a number on it: how much profit do you want at the end of the year?
From there the guide works backward. You build out your expenses and payroll, then set productivity targets for your employees. With those in place, MSA calculates what the shop actually has to do to get to your number — the hourly rate you need to charge and the gross profit you need to earn per billable hour.
Those aren't industry averages or rules of thumb. They come from your real expenses, your real payroll, and your real capacity. And the guide reports results weekly, with tools to make adjustments as the year goes, so a bad stretch shows up while you can still respond to it instead of in next year's tax return.
2. The Employee Service Report — can your team hit those targets?
A target is only useful if the people doing the work can actually reach it, and if you can tell whether they're improving.
The Employee Service Report gives you that read. For flat-rate style work you compare each task's actual result against its estimate. For hourly work you compare against the time clock. Either way, every kind of labor gets accounted for, and the results feed straight back into the productivity targets in the Profitability Guide.
This is also what makes the conversation with a technician a factual one. You're not telling somebody you think they're slow — you're both looking at the same history, on the same tasks, and talking about where it's moving.
3. Task Reports — can what you sell get you there?
The last piece is the one shops skip. You can set a good target and have a productive crew and still miss, because some of the services you sell simply can't produce the hourly rate you need.
Task Reports check each service against the target hourly rate and gross profit per hour, using the actual historical data on that task — what it really takes, not what you assumed when you priced it. Some jobs will be carrying the shop. Some will be quietly costing you every time they roll in.
Once you know which is which, you can reprice, rescope, or stop selling the losers. That's the final piece that makes sure everything on your service menu is contributing to the year you set out to have.
Putting it together
Set the target from real numbers. Confirm your team can reach it and watch it improve. Then confirm the work you sell can actually deliver it. That's the full loop — and it's checkable every week, not once a year when it's too late to matter.
Watch the full walkthrough above.